When the Dashboard Shows Numbers, What Should AI Do?
Beyond the questions raised by Cvent's AI announcement, data is born at the event entrance. Kiosk bottlenecks, badge issuance speed, on-site registration ratio - we examine the AI insights operators truly need.
The Question Raised by Cvent’s AI Announcement, and the Data Beyond It
In the summer of 2026, global event tech company Cvent announced an AI feature update.
Attendees can ask AI about schedules and venues within the event app,
and operators can now ask in natural language: “How many people actually attended today?” and “Which session had the highest engagement rate?”
The direction is right.
Finding data scattered across multiple events and products in natural language without complex reports, and receiving answers, tables, and charts appropriate to one’s permissions.
For a massive enterprise platform, simply making data easily accessible is itself a meaningful starting point.
However, the data that AI answers from is data generated within registration and the app.
I was curious about the data generated outside of that - right at the entrance of the event venue.
Seeing the announcement that AI would answer the question “How many people actually attended today?”, a different question came to mind.
“Then, where exactly is a bottleneck occurring in check-in and entry right now, and what are the ways to reduce check-in time at the bottleneck section?”
What the Number “5,000 Registrants” Cannot Answer
Having operated MICE venues for 25 years, I have learned one thing.
The number of 5,000 registrants alone cannot determine equipment and staffing.
What the person in charge actually needs to know is something else entirely.
| Questions Needed On-site | Can Registration Data Alone Answer This? |
|---|---|
| When do attendees arrive in concentration? | ✗ |
| What is the proportion of on-site registration? | ✗ |
| How long does it take to issue one badge? | ✗ |
| At which point does a bottleneck occur? | ✗ |
| How many kiosks and how many staff are needed? | ✗ |
The numbers exist. But those numbers do not lead to on-site judgment.
The number of registrants only speaks to scale; the decisions an operator actually needs to make on the morning of the event day
- How many kiosks to place and where
- Which routes to station guide staff on
- Whether badge paper will hold out
are not answered.
Data Born at the Event Entrance: Kiosks, Badges, Arrival Patterns
The event entrance is the space where data is created most densely.
As an attendee scans a QR code, the kiosk prints a badge,
and the door opens — nearly everything an operator needs to know is recorded in those few seconds.
FAIRPASS collects this data in real time even now.
- Registration & Payment Status: Pre-registration completion rate, distribution by payment method
- On-site Check-in Status: Number of check-ins by time slot, QR vs. on-site registration ratio
- Badge Issuance Volume per Kiosk: Immediately confirmed from print data - which device has issuance concentrated on it
- Entry Status: Who entered, when, and through which door
However, how many people are currently in line in front of those kiosks still requires human eyes to see.
The data exists, but interpreting that data to say “guide staff need to be sent to kiosk #1 right now” -
that is still within the domain of human judgment.
That is FAIRPASS 2.0’s homework.
The Dashboard Shows the Numbers, AI Delivers the Next Action
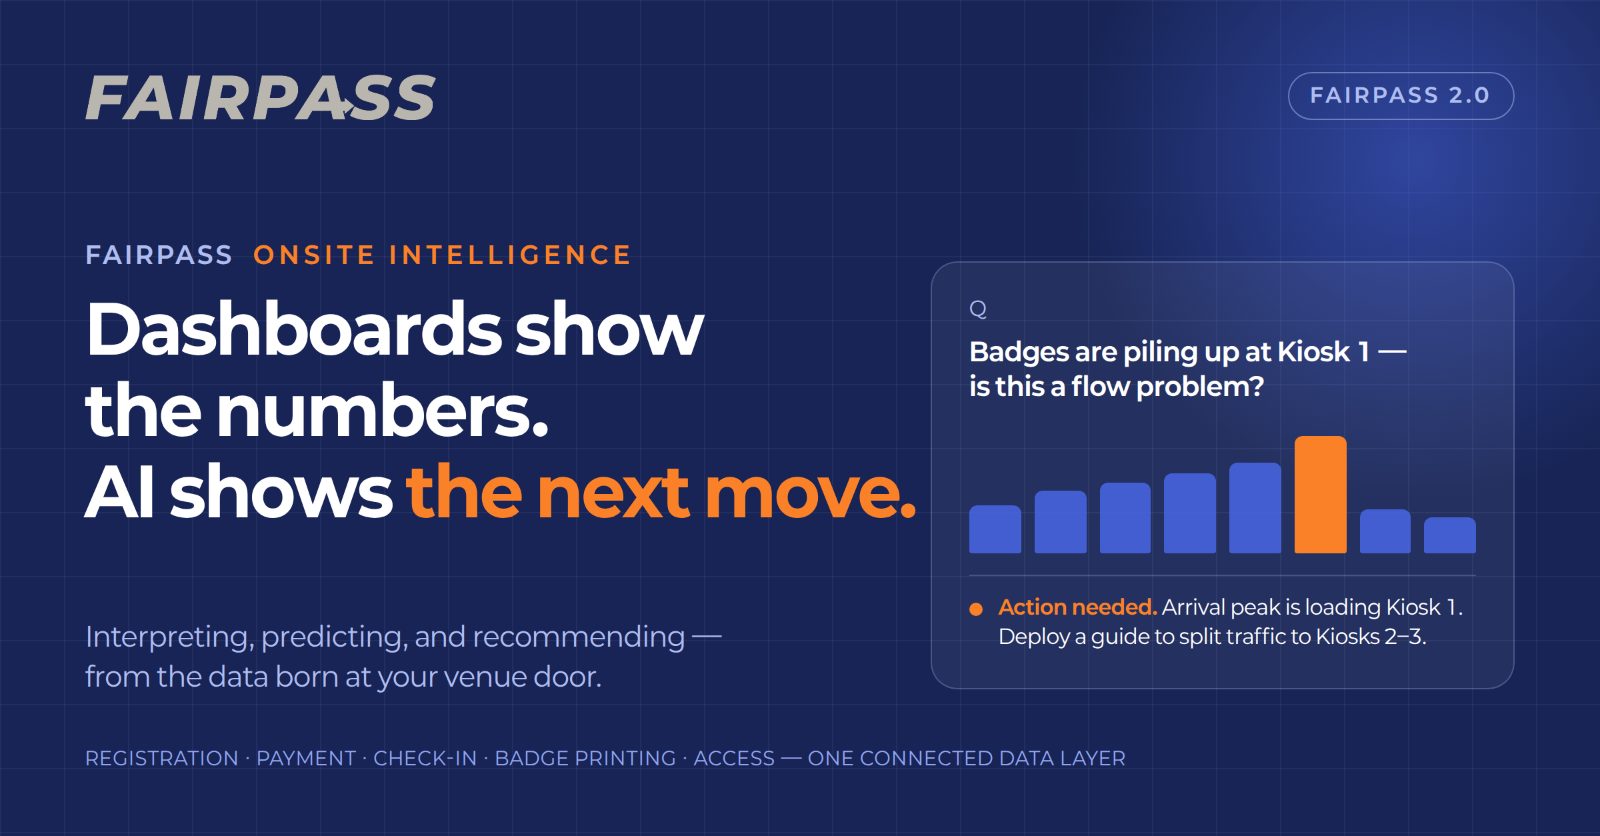
What on-site operators actually want to receive is not numbers. It is action guidance.
The AI FAIRPASS aims to build answers questions like these:
“What time will attendees be most concentrated, and how many kiosks and how many staff are needed?”
“Is the issuance being concentrated only on kiosk #1 a flow path issue, or is it a signal that guide staff need to be deployed now?”
“The proportion of on-site registration is higher than expected. Will the badge paper hold out to the end?”
“How much operating time, staffing, printed materials, and waste were reduced at this event?”
These are questions that can only be answered by reading online-collected registration data and on-site data together.
Registration, payment, check-in, badge issuance, and entry - the data from the moments people move on-site must be connected.
While the dashboard shows the numbers, AI first tells the operator the meaning of those numbers and what action they need to take next.
| Role | Responsible Party |
|---|---|
| Real-time figure visualization | Dashboard |
| Anomaly pattern detection | AI |
| Action suggestions (staffing, equipment, flow paths) | AI |
| Event performance conversion (cost, time, ESG) | AI |
| Final decision-making | Operator |
Where FAIRPASS 2.0 Is Headed: An Event Where Operators Work Less Hard
What FAIRPASS has done from the very beginning is one thing. Creating an event where people work less hard.
Online pre-registration, QR on-site check-in, unmanned badge kiosks, 100% paper badges that reduce plastic use -
all of these products were meant to reduce the effort of event staff manually printing badges, checking attendance by hand,
and organizing data manually after the event.
The direction FAIRPASS 2.0 is heading is the same.
Only now, it goes one step further.
- Until now: Showing data
- FAIRPASS 2.0: Interpreting, predicting, and suggesting based on data
The time operators spend reading dashboards and making judgments - AI reduces that first.
It sends signals before bottlenecks occur, and after the event ends, it reports cost, time, and ESG reduction figures as well.
FAQ: Frequently Asked Questions About Event AI and On-site Data
Q. Can event AI analyze registration data and on-site check-in data together?
A. It depends on the platform. AI based on registration and payment data only reads pre-event data.
In cases like FAIRPASS, where everything from registration to on-site check-in, kiosk badge issuance, and entry status is collected on a single platform,
it is possible to connect and analyze data generated in real time on-site as well.
For on-site operational judgment - staffing deployment, kiosk flow paths, badge consumption prediction - this on-site data is essential.
Q. Can AI predict how many kiosks are needed at an event?
A. Accurate prediction is difficult based on the number of registrants alone.
Reliable prediction becomes possible when on-site data is available together — arrival patterns by time slot, on-site registration ratio, average issuance time per badge, event venue flow paths, and more.
FAIRPASS is developing this prediction feature as a core direction of FAIRPASS 2.0, based on accumulated event on-site data.
Q. How are unmanned kiosk badge issuance and AI operational suggestions connected?
A. Every time a kiosk issues a badge, the issuance time, kiosk number, and attendee type (pre-registered/on-site registration) are recorded.
As this data accumulates, patterns emerge showing at which time slots and at which kiosks load is concentrated.
AI reads these patterns and delivers actionable suggestions to operators, such as: “Wait times at kiosk #1 are currently increasing.
Redeployment of guide staff is recommended.”
While the dashboard shows the numbers,
AI tells the operator what they need to do next - that is the on-site experience.
FAIRPASS 2.0 is heading there.
For on-site registration, check-in, kiosks, and badges right now, FAIRPASS is already with you.
If you want to prepare your next event more solidly, please contact FAIRPASS.
Frequently Asked Questions
Q. What data is needed for AI to be genuinely helpful to operators at an event venue?
A. Registration and payment data alone is not sufficient.
For actual operational judgment, data from the moments people move on-site is needed - attendee arrival time slots, proportion of on-site registration, badge issuance speed per kiosk, and the timing of bottleneck occurrences by section.
Only when AI can connect this data and determine ‘whether the issuance being concentrated on kiosk #1 right now is a flow path issue, or a signal that guide staff deployment is needed’
can it finally provide operators with practical action guidance.
Q. How can bottlenecks during event kiosk operations be prevented?
Kiosk bottlenecks most commonly arise from failure to predict peak arrival time slots, insufficient number of kiosks, flow path design errors, and underestimating the proportion of on-site registrations.
Combining pre-registration data with arrival patterns from past events to calculate expected issuance volume by time slot, and pre-distributing kiosk numbers and guide staff, is effective.
Monitoring issuance status per kiosk via a real-time dashboard allows bottleneck signs to be captured immediately, increasing the speed of on-site response.
Q. What problems arise when the proportion of on-site registration is high at an event, and how should one prepare?
When the proportion of on-site registration is higher than expected, badge paper exhaustion, payment processing delays, and entrance congestion can occur simultaneously.
It is necessary to set an expected on-site registration proportion in advance based on past event data, and to operate a separate stock of spare badge paper and a dedicated on-site registration counter.
If there is a system that alerts operators in real time when the cumulative on-site registration volume approaches a threshold, response time can be secured.
📬 Contact Us
FAIRPASS is ready to support your next event, whenever you need us.
fairpass@fairpass.world
Changing one badge can simultaneously elevate operational efficiency, environmental responsibility, and brand value.
Ready to streamline your next event?
Get a free consultation — no commitment required.
Get a free quote →